Translate this page into:
Measuring irregularity index: Comparing study cast caliper method with 2D dimensional ImageJ photogrammetry and 3D STL image measurement
This article was originally published by Wolters Kluwer and was migrated to Scientific Scholar after the change of Publisher.
Abstract
Purpose
Irregularity accounts for interproximal contact point displacements and can be measured using a variety of techniques. The aim of this study was to evaluate the validity and reliability of three methods in relation to the “gold standard” of manual caliper measurements of plaster study casts.
Materials and Methods
Six mandibular study casts representing varying degrees of anterior crowding were measured by the same observer using four methods over the course of 5 weeks. Validity was statistically assessed with single sample statistical testing by the cast, method, and week (or combinations) and reliability was tested using intraclass reliability coefficient.
Results
The three noncaliper techniques demonstrated validity (P > 0.05) when the caliper method mean was used as the set value, but the three noncaliper methods produced means that were significantly greater when mean differences among techniques were compared to hypothetical zero. However, none of the differences were clinically significant (>0.5 mm). High reliability (reproducibility) was demonstrated (P > 0.05) with both aggregated and nonaggregated mean differences.
Conclusions
Reliability of measuring irregularity index with any of the four methods tested was high, but the validity of techniques compared to the “gold standard” method of manual caliper measurements of plaster study casts should continue to be questioned. Differences among the techniques were not clinically significant or important.
Keywords
Irregularity index
methods of measurement
validity and reliability

Introduction
Anterior dental arch crowding may be the most frequently occurring characteristic of malocclusion and reason for orthodontic treatment, yet the term “crowding” is ambiguous and often subjectively quantified as mild, moderate, or severe.[1] There are two basic methods of measuring anterior dental arch crowding: anterior arch length discrepancy (ALD) and irregularity index. Anterior ALD includes the comparison of mesiodistal tooth sizes with arch length space available; this technique accounts for tooth axial inclinations which are important in making orthodontic treatment planning decisions. Irregularity index is a measure of interproximal contact displacements projected onto the occlusal plane and is useful in epidemiology studies concerned with anterior crowding or irregularity.[2]
Little’s Irregularity Index was published in 1975 as a means to objectively score mandibular incisor contact displacement thereby quantifying mandibular anterior crowding.[3] By using the technique, the horizontal linear distance between anatomic contacts of the incisors in the labiolingual direction is measured parallel to the occlusal plane.[4] The cumulative sum of the five horizontal interproximal displacements thereby constitutes the irregularity index score, and higher index scores represent the more severe labiolingual displacement of the teeth. Starting from and ending at the mesial anatomic contacts of the canines, Little’s Irregularity Index is two-dimensional (2D) and vertical displacements are ignored.[5]
The “gold standard” for irregularity index determination is manual caliper measurements of plaster study casts. According to Almasoud et al.,[4] 2D methods for irregularity index determination include occlusal scanning of study casts with a flatbed scanner, photocopies of the occlusal surfaces of the maxillary or mandibular study casts or photographic images of the patient’s dental arches or study casts. In the determination of irregularity index using any of the 2D techniques, either direct measurement with calipers or digitizing the photocopied images is performed.
Differences in irregularity index have been compared between direct caliper measurements of study casts (gold standard) and digital measurements of 2D images using ImageJ software. Tran et al.[6] compared means of 2D scanned images of plaster study casts with the manual caliper method, reported high agreement, and concluded that ImageJ measurement technique was a valid and reliable alternative method for the determination of irregularity index. Almsound et al.[4] compared photogrammetric ImageJ measurements of both plastic study casts and patient dental arches to direct caliper measurements of study casts; conclusions were in agreement with Tran et al.[6] with regard to photographic images of study casts, but the authors suggested caution in the use of clinical photographs. Both studies concluded that ImageJ measurement technique on photographs of study casts to determine irregularity index was valid and reliable and could be used interchangeably with the “gold standard” manual caliper measurement on plaster study casts technique.[4,5]
Photographs are a 2D representation of a 3D dental arch but may suffer from errors of projection. If the photographic image is taken at an angle other than 90° to the occlusal plane, a vertical component of the contact point displacement may be introduced. Almasoud et al.[4] tested this notion on three occasions 1-day apart by securing occlusal photographs of 10 plastic models with different levels of incisor irregularity. On each occasion, photographs were taken of each model at 9 angulations from 70°–110° at 5° intervals, giving 270 images. The authors reported measurements highly repeatable at a zone of 20° from perpendicular to the occlusal plane. Photographing at or near 90° to the occlusal plane is easier with study casts but more problematic in clinical photographs of the patient dental arch. Again, Almasoud et al. cautioned the use of clinical patient photographs of dental arches for use in the determination of irregularity index.[4]
Since the introduction of 3D digital imaging techniques to dentistry, irregularity index can be measured either two- or three-dimensionally. Irregularity index scored from 3D digital study casts have been reported as reliable.[7,8] Stevens et al.[9] reported no clinically relevant difference in reliability between digital and plaster models. One systematic review on the use of 3D digital models concluded they are as reliable as traditional plaster models with high accuracy, reliability, and reproducibility.[10] Another systematic review on orthodontic measurements using 3D digital study casts concluded 3D measurement techniques were valid and there were no clinically significant differences from plaster study cast measurements including irregularity index; hence, digital models offered a valid alternative to plaster study casts.[11]
The purpose of the present validity and reliability study was to compare the “gold standard” determination of irregularity index, i.e., using caliper measurement of plaster study casts, to the following: (1) ImageJ software measurements applied to digital photographs of the occlusal surface of study casts and (2) measurements made on 3D digital scans of conventional study models (STL images). The null hypotheses were no differences in irregularity index between gold standard, 2D ImageJ photogrammetry and 3D STL image measurements.
Materials and Methods
The approval of the Institutional Review Board at European University College was obtained to conduct this research project.
Sample
The sample consisted of six pretreatment mandibular dental arch casts with varying degrees of anterior crowding selected randomly from the archives of the Orthodontic Department, European University College, Dubai Healthcare City, UAE. The mandibular study cast inclusion criteria were mild to severe anterior crowding, fully erupted mandibular permanent incisors and canines, no missing teeth anterior to the second permanent molars, and clear visible incisors with no broken or chipped incisal edge.
The irregularity index of each mandibular study casts was measured by four methods: (1) directly on the study cast using a digital caliper, (2) from a standardized photograph of the study cast using ImageJ software, (3) from a standardized 2D scan of study cast STL image using ImageJ software, and (4) on the 3D STL image using 3Shape ortho analyzer software.
Procedures
Irregularity index was measured directly on the study cast with a digital caliper as described by Little[3]
Digital photographs were taken of each mandibular study models using a Pentax DSLR camera with a 105 mm macro lens and ring flash taken at a lens-to-cast occlusal surface distance of 94 mm. All photographs were taken approximately parallel to the long axis of the anterior teeth (90° to occlusal plane). A ruler was placed on the occlusal surface of each cast to quantify the enlargement [Figure 1]
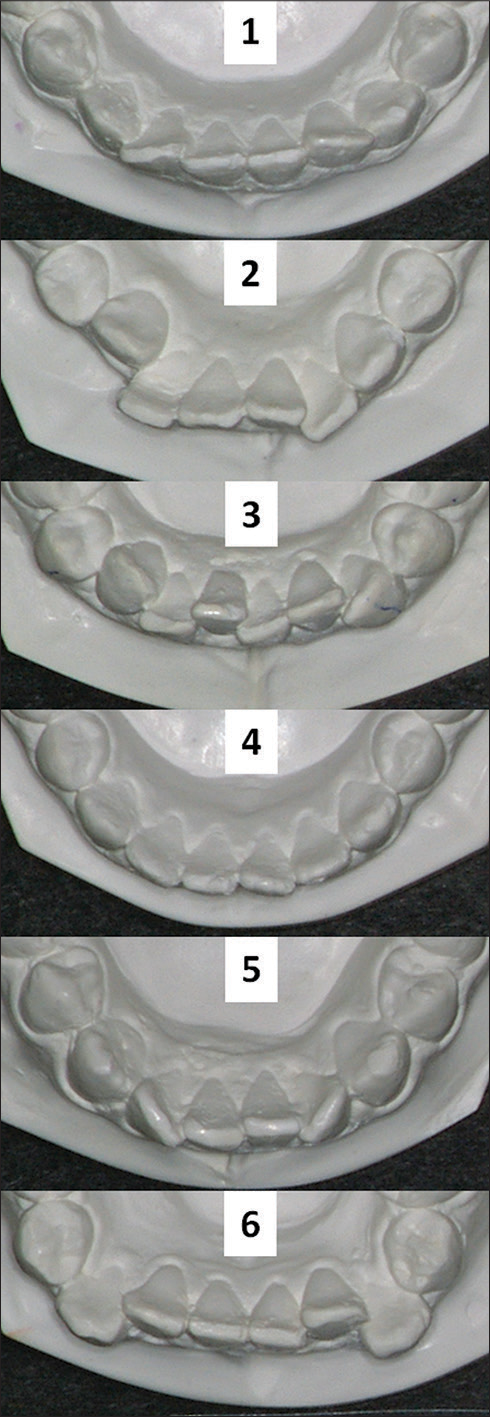 Figure 1
- Digital photographs were taken of the six mandibular study casts in order to determine irregularity index using ImageJ software
The 6 study casts were scanned using a 3Shape 3D model scanner with occlusal image view printed in 2D format
Irregularity index of 2D photographic and scanned images was measured using ImageJ software, a public domain Java processing program inspired by NIH Image that can be downloaded from http://rsb.info.nih.gov/ij/. Each 2D image (scanned and photographic image) was enlarged to 200% to identify the contact points during measurements in ImageJ
Irregularity index was measured on the 3D STL image using 3 Shape software
Irregularity index measurements were repeated on the six study casts during five separate consecutive observation times 1 week apart by the same examiner blinded as to the previous measurements.
Statistical analysis
Data were collected and stored in MS Excel and later transformed for use with the Statistical Package for Social Services software package, (SPSS software v. 15.0.1, IBM, Armonk, NY, USA) for analysis. Dependent variable was irregularity index mean and independent variables were measurement method, measurement week, and study cast. Differences were designated significant at the 95% level of probability (P < 0.05); clinical significance was designated >0.5 mm.
The one sample t-test was used for statistical analysis because the same six mandibular study casts were measured by the same four methods over the course of the same 5 weeks period. Four main assumptions for one sample t-test were met as follows: (1) the dependent variable was continuous (interval) data, (2) the observations were independent of one another, i.e., there was no relationship between the observations, (3) the dependent variable was approximately normally distributed, and (4) the dependent variable did not contain any outliers.
The one sample t-test compared the mean score found in an observed sample of a hypothetically assumed value; the single sample test value was set at zero in most testing circumstances, i.e., the calculated mean differences were hypothetically compared to zero. The one exception in the present study was when aggregated mean irregularity index scores were compared by methods; in this case, the test value was set at the “gold standard” method value, i.e., the caliper method. Nonparametric single sample tests were used when sample sizes were too small to assess normality adequately.
Intraclass correlation coefficient (ICC) was used to measure of the reliability (reproducibility) of measurements made by clusters (data collected as groups or sorted into groups) measuring the same quantity. Unlike most other correlation measures, ICC operates on data structured as clusters, rather than data structured as paired observations. The ICC model used was two-way mixed-effects with the absolute agreement.
Results
Irregularity index was determined by a single (blinded) examiner using four measuring methods described previously: (1) caliper, i.e., direct study cast measurements using a digital caliper, (2) ImageJ, i.e., photogrammetric measurements using ImageJ software, (3) 3D scan, i.e., photogrammetric measurements of a 2D scanned image of 3D STL images using ImageJ software, and (4) 3D STL, i.e., measurements of 3D STL images using 3Shape ortho analyzer software.
Method aggregate
Six mandibular study casts were measured five times (n = 30) and the means and variance of the aggregate (Cast-1 + Cast-2 + Cast-3 + Cast-4 + Cast-5 + Cast-6 by Wk1 + Wk2 + Wk3 + Wk4 + Wk5) were computed per measurement method. Single sample t-testing demonstrated no significant differences (P > 0.05) among the four methods when test value was set at caliper “gold standard” method mean (6.44 mm). The lowest irregularity index mean (6.44 mm) was for the caliper and the highest for the 3D STL method (6.78 mm), a difference of 0.33 mm [Table 1].
| Methods | Mean | SD | Minimum | Maximum |
|---|---|---|---|---|
| Caliper | 6.44 | 2.18 | 3.11 | 9.25 |
| ImageJ | 6.70 | 2.30 | 3.17 | 9.18 |
| 3D scan | 6.75 | 2.17 | 3.34 | 9.54 |
| 3D STL | 6.78 | 2.20 | 3.22 | 9.33 |
One sample testing resulted in no significant differences on the basis of aggregated method means when test value set at caliper mean (6.44 mm). 3D – Three-dimensional; SD – Standard deviation; STL – STL image
Single sample t-test analysis of aggregated method mean differences demonstrated the aggregate of the six study casts measured 5 weeks by caliper was significantly smaller (P = 0.000) than the other three measurement methods. The greatest mean difference between the caliper and the other three methods was 0.33 mm. In contrast, the three noncaliper measurement methods demonstrated high agreement with the greatest mean aggregate difference of 0.07 mm [Table 2].
| Method pairs | Mean different | t | df | P significant |
|---|---|---|---|---|
| Caliper-ImageJ | −0.26 | −4.77 | 29 | 0.000 |
| Caliper-3D scan | −0.31 | −3.98 | 29 | 0.000 |
| Caliper-3D STL | −0.33 | −3.99 | 29 | 0.000 |
| ImageJ-3D scan | −0.05 | −0.80 | 29 | 0.430 |
| ImageJ-3D STL | −0.07 | −1.09 | 29 | 0.285 |
| 3D scan-3D STL | −0.01 | −0.30 | 29 | 0.768 |
The greatest mean difference was 0.33 mm and clinically insignificant. 3D - Three-dimensional; STL - STL Image
Week aggregate
Six mandibular study casts were measured by four methods (n = 24) and means of the aggregate (Cast-1+Cast-2+Cast-3+Cast-4+Cast-5+Cast-6 by caliper + ImageJ + 3Dscan + 3DSTL) were compared by week. One sample testing demonstrated no significant differences between aggregated week mean differences when test value was set at zero; the greatest aggregated week mean difference was 0.045 mm demonstrating high agreement. Intraclass reliability coefficient for aggregated means was very high (0.999, P = 0.000).
Cast aggregate
Each cast was measured for 5 weeks by the four methods (n = 20) and the means of the aggregate (Wk1+Wk2+Wk3+Wk4+Wk5 by caliper + ImageJ + 3Dscan + 3DSTL) were analyzed by the cast. One sample t-testing of aggregated cast mean differences with test value = 0 demonstrated significant differences among methods (P < 0.05) except for the comparison of cast-2 (8.82 mm) and cast-6 (8.85 mm, P = 0.84).
Week-method
Six casts were measured by each method (n = 6) and the means of the aggregate (Cast-1+Cast-2+Cast-3+Cast-4+Cast-5+Cast-6) were compared by week-method. Single sample Kolmogorov–Smirnov testing with uniform distribution and test value = 0 for week-method pairs resulted in a significant difference between week-2 and week-5 (0.22 mm, P = 0.027) for 3D scan method (not shown). Intraclass reliability coefficient for means aggregated by week-method was very high (0.999, P = 0.000).
Cast-method
Each cast was measured for 5 weeks (n = 5) and the means of the aggregate (Wk1+Wk2+Wk3+Wk4+Wk5) per cast were compared by using cast-method. Mean differences were significant only for the ImageJ measurement method between cast-2 and cast-6 (8.31 vs. 9.00 mm, P = 0.023) as determined by single sample Kolmogorov–Smirnov test with uniform distribution; mean difference was 0.68 mm (not shown).
Mean difference analysis of cast-2 by method (n = 5) using single sample Kolmogorov–Smirnov test with uniform distribution demonstrated irregularity index for 3D STL (9.04) was significantly higher than ImageJ (8.31 mm, P = 0.049). In contrast, the same test for cast-6 means showed irregularity index for 3D STL (8.63) was significantly less than for ImageJ (9.00 mm, P = 0.044); mean differences were 0.36 and 0.73 mm [Table 3].
| Cast | Method | Method | Mean different | P significant | |
|---|---|---|---|---|---|
| 2 | ImageJ | 3D | STL | −0.73 | 0.049 |
| 6 | ImageJ | 3D | STL | 0.36 | 0.044 |
Greatest mean difference was 0.73 mm. Two casts with nearly identical irregularity index aggregate scores, mean ImageJ score was less than mean 3D STL score for cast-2 with proclined incisors but higher for cast-6 with retroclined incisors. 3D - Three-dimensional; STL - STL image
Cast-week
Each cast was measured by four methods (n = 4) and the means of the aggregate (caliper + ImageJ + 3Dscan + 3DSTL) were compared by cast-week. The one sample Kolmogorov–Smirnov test with test value = 0 and uniform distribution demonstrated no statistically significant differences (P > 0.05) for all cast-week pairs. The greatest difference between means detected was 0.34 mm (P =0.068) between week-2 and week-5 for cast-5 (not shown). Intraclass reliability coefficient for means aggregated by cast-week was high (>0.92, P ≤ 0.001) for casts 2, 3 and 6, moderate (>0.81 and < 0.87, P < 0.02) for casts 1 and 4, and low (0.635, P = 0.069) for cast 5 [Table 4].
| Cast | Intraclass coeffcient | P significant |
|---|---|---|
| 1 | 0.862 | 0.011 |
| 2 | 0.920 | 0.001 |
| 3 | 0.930 | 0.000 |
| 4 | 0.814 | 0.012 |
| 5 | 0.635 | 0.069 |
| 6 | 0.938 | 0.000 |
High correlations were found for casts 2, 3 and 6, moderate correlations were found for casts 1 and 4 and a low correlation was found for cast-5
Discussion
Data comparing mean irregularity index among four measurement methods were analyzed in six ways: (1) six casts for 5 weeks (n = 30) analyzed by method aggregate, (2) six casts by four methods (n = 24) analyzed by week aggregate, (3) each cast for 5 weeks by the four methods (n = 20) and analyzed by cast aggregate, (4) six casts by each method (n = 6) and the aggregated mean differences per week compared by method, (5) each cast for 5 weeks (n = 5) and mean differences per cast compared by method, and (6) each cast by four methods (n = 4) and mean differences per cast compared by week.
Validity
The definition of validity, as applied to the present study, is whether or not the measurement technique or method captures the irregularity index information it is intended to provide, i.e., how well each of the four measurement methods reflects the reality it claims to represent. The “gold standard” for comparison in the present study was the caliper method used on the physical study cast. Comparing aggregated mean scores of six casts measured for 5 weeks (n = 30) using one sample t-test demonstrated no significant differences (P > 0.05) among means; hence, comparison under this testing condition resulted in “validity” of all three noncaliper methods.
In contrast, validity was not supported when aggregated method means were compared to test value = 0 using single sample parametric testing; significant differences among methods emerged between caliper and the other three methods (P < 0.05), whereas the noncaliper methods were not different (P > 0.05) from each other. The greatest difference between caliper method and others was 0.33 mm which was not clinically significant, i.e., not > 0.5 mm.
Reliability
The definition of reliability, as applied to the present study, is whether or not the techniques are repeatable from 1 week to the next. The six casts measured by all four methods (n = 24) compared by an aggregated week means demonstrated no significant differences. Hence, high reliability was demonstrated (P > 0.05) among aggregated week-means from week-1 to week-5. When tested by week-method (n = 6), only the 3D scan method demonstrated a difference between week-2 and week-5 (0.22 mm, P = 0.027), i.e., high reliability was demonstrated when irregularity means were separated out by the method. Intraclass reliability coefficients for means aggregated by week (n = 24) and for means aggregated by week-method (n = 6) were very high (0.999, P = 0.000). ICCs computed for each cast by cast-week (n = 4) showed correlations that were high for casts 2, 3, and 6, moderate for casts 1 and 4 and low for cast 5.
Cast individuality
Each cast presented unique characteristics that defined the irregularity index score; average irregularity index score ranged from 3.39 mm to 8.85 mm among the six mandibular study casts. Because each cast was measured for 5 weeks by the four methods (n = 20) and analyzed by aggregated cast mean differences, significant differences were expected because of cast individuality. However, the comparison of cast-2 and cast-6 demonstrated similarity (8.82 vs. 8.85, P = 0.84) as the two mean cast scores differed by only 0.03 mm. This unexpected similarity in mean irregularity index score between cast-2 and cast-6 provided a unique testing opportunity. Single sample nonparametric testing of cast-2 and cast-6 differences analyzed by week (n = 4) showed excellent repeatability (P > 0.05). In contrast, testing of cast-2 and cast-6 differences analyzed per method (n = 5) demonstrated a significant difference (0.68 mm, P = 0.023) with ImageJ method. Since the aggregated irregularity index scores for cast-2 and cast-6 were nearly identical (differing by only 0.03 mm), the significant difference discovered in measuring cast-2 and cast-6 with the ImageJ method raises questions about technique validity or the presence of a data outlier which would be in violation of a main assumption for nonparametric one sample testing.
The Bland-Altman plot technique would generally be used for assessing agreement between clinical measurements of two casts with nearly identical mean irregularity index scores.[11,12] However, this plot is inappropriate when two means are statistically different from each other as was demonstrated in the present study.[13] Hence, the speculation that the dependent variable contained a data outlier cannot be ruled out.
As mentioned previously, cast-2 and cast-6 were statistically similar in irregularity index magnitude (mean difference 0.03 mm, P = 0.84), but measurement by methods ImageJ and 3D STL differed unexpectedly. The mandibular incisors were proclined for cast-2 and retroclined for cast-6 [Figure 2]. For cast-2, the 3D STL mean was significantly larger than ImageJ (9.04 vs. 8.31 mm, P = 0.049), but for cast-6 the reverse was found; 3D STL mean was significantly smaller than the ImageJ mean (8.63 vs. 9.00 mm, P = 0.044). The most reasonable explanation for this difference is that the 2D image measured with ImageJ technology did not accurately portray differences in incisor inclination or account for vertical displacements.
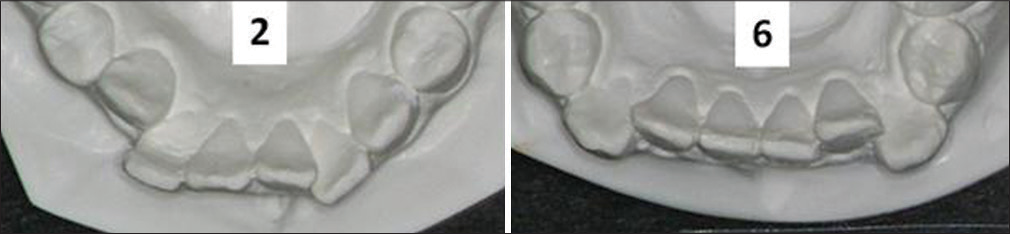
- Digital photographs of cast-2 showing inclisor proclination and cast-6 showing incisor retroclination. Note: 3D STL measurement method yielded a significantly larger irregularity index mean than the ImageJ method for proclined incisors but a significantly smaller mean for retroclined incisors
Whether or not the ImageJ method for measuring irregularity will consistently produce different results than the 3D STL method when mandibular incisors are either proclined or retroclined needs further investigation and is beyond the scope of the present study. Keating et al.[15] reported the mean difference between measurements made directly on the plaster models and those made on the 3D digital surface models was 0.14 mm and was not statistically significant (P = 0.24). However, Czarnota et al.[12] reported larger irregularity index scores are likely using the 3D technique compared to 2D technique.
What the present study demonstrated is that aggregating scores of study casts with varying degrees of crowding, i.e., mixing casts by method and/or week, serves to mollify measurement differences. In contrast, emphasizing the individuality of the crowding conditions serves to elucidate irregularity index measurement differences between methods.
The reader needs to be reminded that irregularity index is a measure of incisor contact point displacement and is a poor representation of anterior ALD. The degree of clinical crowding assessment needed for orthodontic treatment should include an assessment of axial inclinations which irregularity does not provide.[2] Harris et al.[16] correlated irregularity index with the anterior ALD measuring technique of Merrifield and reported a statistically significant but low relationship (r = 0.53). Bernabé and Flores-Mir[17] correlated irregularity index with ALD as anterior arch perimeter subtracted from the sum of the mesio-distal anterior teeth widths (ALD); the correlation reported was statistically significant but also low in relationship (r = 0.68). The irregularity index is a measure of irregularity alone and does not account of axial inclinations of teeth as in the ALD techniques. As such, irregularity index is often an underestimate of the degree of clinical crowding useful in orthodontic treatment planning. Macauley et al.[1] concluded that use of irregularity index for measuring the outcome of orthodontic treatment modalities in clinical practice should be emphatically discouraged.
Conclusions
Six mandibular study casts representing varying degrees of anterior crowding were measured using four different methods over the course of 5 weeks to determine Little’s irregularity index. Both aggregated and nonaggregated data were statistically analyzed by cast, method and/or week (or combinations) to assess technique validity and reliability. Under the conditions of the study, the following may be summarized:
The three noncaliper techniques demonstrated validity (P > 0.05) when the caliper method was used as the “gold standard” for single sample comparisons. However, the three noncaliper methods produced significantly greater mean irregularity index scores when mean differences among techniques were compared to hypothetical zero. However, none of the differences were clinically significant (>0.5 mm)
High reliability was demonstrated (P > 0.05) among aggregated week-means (n = 24) from week-1 to week-5. When tested by week-method (n = 6), only the 3D scan method demonstrated a difference between week-2 and week-5 (0.22 mm, P = 0.027). Intraclass reliability coefficient was low only for cast-5 but otherwise moderate to high for the other five mandibular study casts.
Under the testing conditions of the present study, the reliability of measuring irregularity index with four methods was high, but the validity of the three techniques compared to the “gold standard” method of manual caliper measurements of plaster study casts should continue to be questioned.
Financial support and sponsorship
Nil.
Conflicts of interest
There are no conflicts of interest.
References
- Using little’s irregularity index in orthodontics: Outdated and inaccurate? J Dent. 2012;40:1127-33.
- [CrossRef] [PubMed] [Google Scholar]
- Class I malocclusions - The development and etiology of mandibular malalignments. Semin Orthod. 2014;20:3-15.
- [Google Scholar]
- The irregularity index: A quantitative score of mandibular anterior alignment. Am J Orthod. 1975;68:554-63.
- [CrossRef] [Google Scholar]
- Little’s irregularity index: Photographic assessment vs. study model assessment. Am J Orthod Dentofacial Orthop. 2010;138:787-94.
- [CrossRef] [Google Scholar]
- Comparison of measurements made on digital 2D models and study casts. Acta Fac Med Naiss. 2009;26:187-94.
- [Google Scholar]
- Reliability and validity of a computer-based little irregularity index. Am J Orthod Dentofacial Orthop. 2003;123:349-51.
- [Google Scholar]
- The reliability of little’s irregularity index for the upper dental arch using three dimensional (3D) digital models. J Dent. 2014;42:1320-6.
- [CrossRef] [PubMed] [Google Scholar]
- Can the intra-examiner variability of little’s irregularity index be improved using 3D digital models of study casts? J Dent. 2013;41:1271-80.
- [Google Scholar]
- Validity, reliability, and reproducibility of plaster vs. digital study models: Comparison of peer assessment rating and Bolton analysis and their constituent measurements. Am J Orthod Dentofacial Orthop. 2006;129:794-803.
- [CrossRef] [PubMed] [Google Scholar]
- Diagnostic accuracy and measurement sensitivity of digital models for orthodontic purposes: A systematic review. Am J Orthod Dentofacial Orthop. 2016;149:161-70.
- [Google Scholar]
- Orthodontic measurements on digital study models compared with plaster models: A systematic review. Orthod Craniofac Res. 2011;14:1-6.
- [Google Scholar]
- Measurements using orthodontic analysis software on digital models obtained by 3D scans of plaster casts: Intrarater reliability and validity. J Orofac Orthop. 2016;77:22-30.
- [Google Scholar]
- Reliability and validity of a computer-based Little irregularity index. Am J Orthod Dentofacial Orthop. 2003;124:13A-4A.
- [Google Scholar]
- Comparing methods of measurement: Why plotting difference against standard method is misleading. Lancet. 1995;346:1085-7.
- [CrossRef] [Google Scholar]
- A comparison of plaster, digital and reconstructed study model accuracy. J Orthod. 2008;35:191-201.
- [Google Scholar]
- Lower incisor space analysis: A contrast of methods. Am J Orthod Dentofacial Orthop. 1987;92:375-80.
- [Google Scholar]
- Estimating arch length discrepancy through Little’s irregularity index for epidemiological use. Eur J Orthod. 2006;28:269-73.
- [CrossRef] [Google Scholar]